Fitxer:Brown noise spectrum.png
Salta a la navegació
Salta a la cerca
No hi ha cap versió amb una resolució més gran.
Brown_noise_spectrum.png (800 × 600 píxels, mida del fitxer: 5 Ko, tipus MIME: image/png)
Resum
| Descripció |
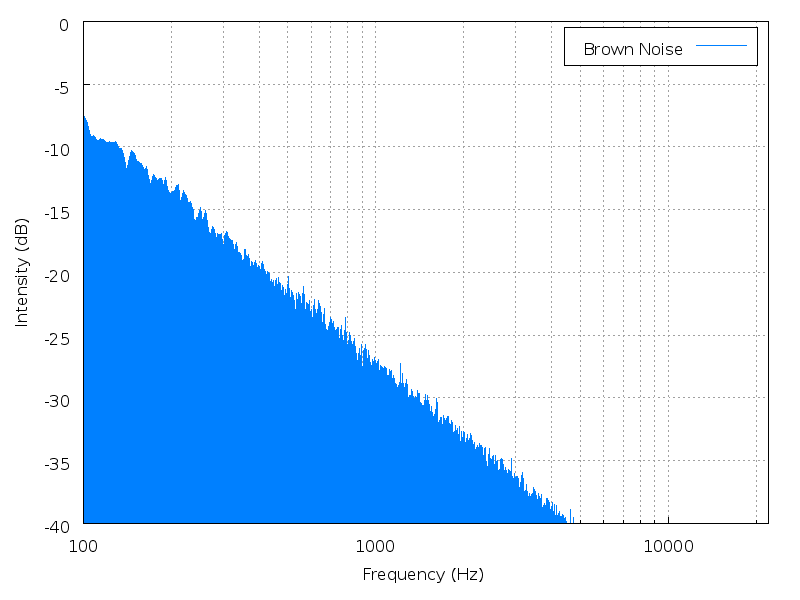
English: Brown noise spectrum. The analysis was done using Audacity, and plotting with gnuplot. Transparency was touched up in GIMP to make the graph background pure white.
Русский: Спектр броуновского шума |
| Data | |
| Font | Treball propi |
| Autor | Javg |
| Altres versions |
|


|
File:Brown noise spectrum.svg és una versió vectorial (SVG) d'aquest fitxer. En cas de ser millor, hauria de ser emprada en lloc d'aquesta imatge tramada.
File:Brown noise spectrum.png → File:Brown noise spectrum.svg
Per a més informació pel que fa als gràfics vectorials, llegiu la transició a SVG en Commons. També hi ha informació quant a la compatibilitat del MediaWiki amb les imatges SVG. |
 |
Spectrum analysis of the uncompressed source for . Note the logarithmic frequency scale.
Instructions
Obtain the frequency analysis from Audacity, set the maximum number of windows, and use a Hamming window. The following script was used to generate the image:
Llicència
| Jo, el titular del copyright d'aquesta obra, l'allibero al domini públic. Això s'aplica a tot el món. En alguns països això pot no ser legalment possible, en tal cas: Jo faig concessió a tothom del dret d'usar aquesta obra per a qualsevol propòsit, sense cap condició llevat d'aquelles requerides per la llei. |
Historial del fitxer
Cliqueu una data/hora per veure el fitxer tal com era aleshores.
| Data/hora | Miniatura | Dimensions | Usuari/a | Comentari | |
|---|---|---|---|---|---|
| actual | 14:07, 26 nov 2006 | | 800 × 600 (5 Ko) | wikimediacommons>Javg | == Summary == Spectrum analysis of the uncompressed source for {{Audio|Brown noise.ogg|10 seconds of brown noise}}. Note the logarithmic frequency scale. The analysis was done using Audacity, and plotting with gnuplot. Transparency was touched up |
Ús del fitxer
La pàgina següent utilitza aquest fitxer: