Fitxer:Mplwp universe scale evolution.svg
Salta a la navegació
Salta a la cerca

Mida d'aquesta previsualització PNG del fitxer SVG: 600 × 450 píxels. Altres resolucions: 320 × 240 píxels | 640 × 480 píxels | 1.024 × 768 píxels | 1.280 × 960 píxels | 2.560 × 1.920 píxels.
Fitxer original (fitxer SVG, nominalment 600 × 450 píxels, mida del fitxer: 57 Ko)
Resum
| Descripció |
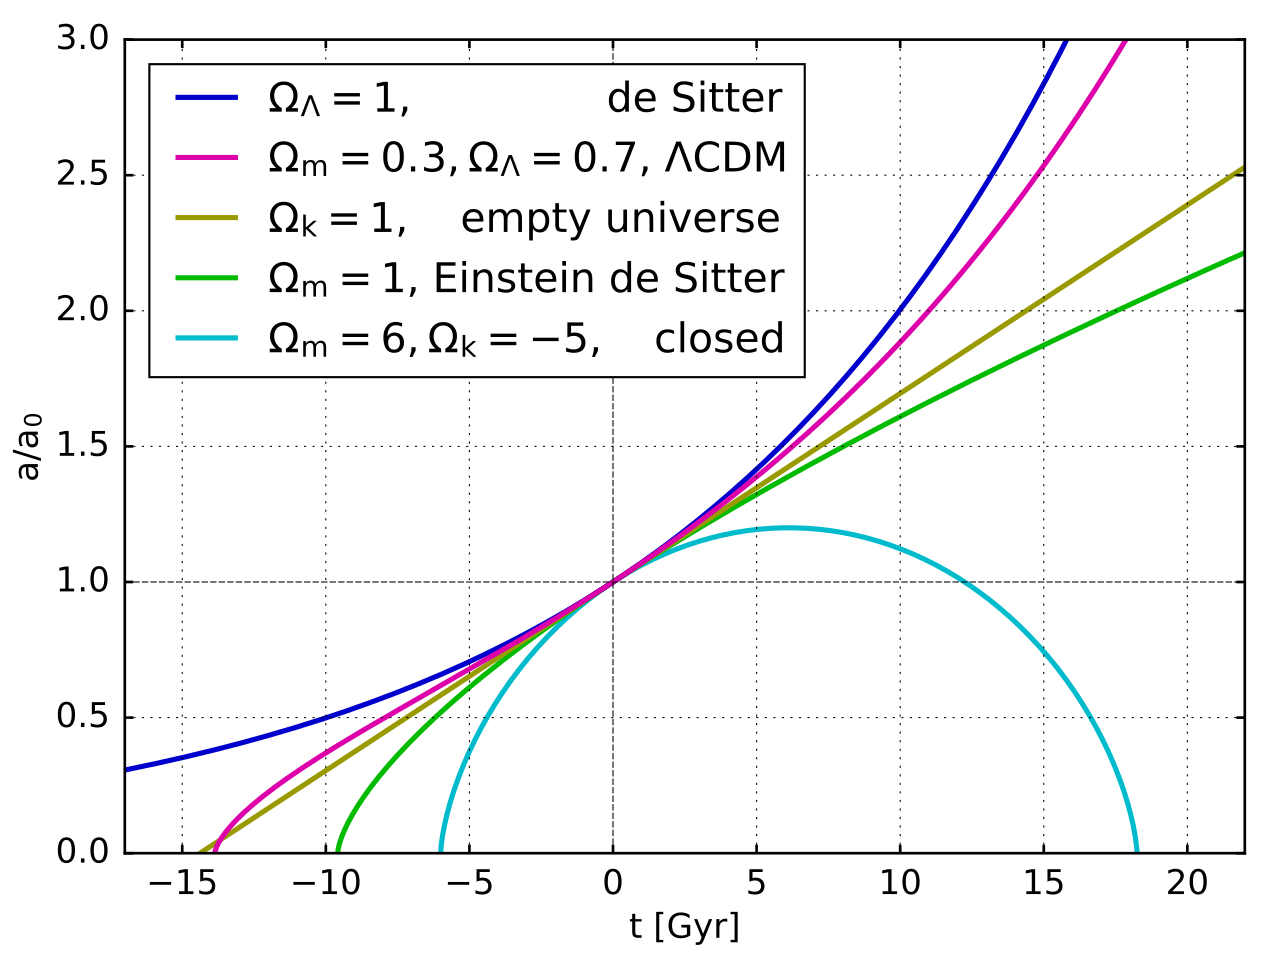
English: Plot of the evolution of the size of the universe (scale parameter a) over time (in billion years, Gyr). Different models are shown, which are all solutions to the Friedmann equations with different parameters. The evolution is governed by the equation
Here is the radiation density, the matter density, the curvature parameter and the dark energy, all normalized such that represents the fact that today's expansion rate is .
|
| Data | |
| Font | Treball propi |
| Autor | Geek3 |
| SVG genesis | |
| Codi font | Python code#!/usr/bin/python
# -*- coding: utf8 -*-
import matplotlib.pyplot as plt
import matplotlib as mpl
import numpy as np
from math import *
code_website = 'http://commons.wikimedia.org/wiki/User:Geek3/mplwp'
try:
import mplwp
except ImportError, er:
print 'ImportError:', er
print 'You need to download mplwp.py from', code_website
exit(1)
name = 'mplwp_universe_scale_evolution.svg'
fig = mplwp.fig_standard(mpl)
fig.set_size_inches(600 / 72.0, 450 / 72.0)
mplwp.set_bordersize(fig, 58.5, 16.5, 16.5, 44.5)
xlim = -17, 22; fig.gca().set_xlim(xlim)
ylim = 0, 3; fig.gca().set_ylim(ylim)
mplwp.mark_axeszero(fig.gca(), y0=1)
import scipy.optimize as op
from scipy.integrate import odeint
tH = 978. / 68. # Hubble time in Gyr
def Hubble(a, matter, rad, k, darkE):
# the Friedman equation gives the relative expansion rate
a = a[0]
if a <= 0: return 0.
r = rad / a**4 + matter / a**3 + k / a**2 + darkE
if r < 0: return 0.
return sqrt(r) / tH
def scale(t, matter, rad, k, darkE):
return odeint(lambda a, t: a*Hubble(a, matter, rad, k, darkE), 1., [0, t])
def scaled_closed_matteronly(t, m):
# analytic solution for matter m > 1, rad=0, darkE=0
t0 = acos(2./m-1) * 0.5 * m / (m-1)**1.5 - 1. / (m-1)
try: psi = op.brentq(lambda p: (p - sin(p))*m/2./(m-1)**1.5
- t/tH - t0, 0, 2 * pi)
except Exception: psi=0
a = (1.0 - cos(psi)) * m * 0.5 / (m-1.)
return a
# De Sitter http://en.wikipedia.org/wiki/De_Sitter_universe
matter=0; rad=0; k=0; darkE=1
t = np.linspace(xlim[0], xlim[-1], 5001)
a = [scale(tt, matter, rad, k, darkE)[1,0] for tt in t]
plt.plot(t, a, zorder=-2,
label=ur'$\Omega_\Lambda=1$, de Sitter')
# Standard Lambda-CDM https://en.wikipedia.org/wiki/Lambda-CDM_model
matter=0.3; rad=0.; k=0; darkE=0.7
t0 = op.brentq(lambda t: scale(t, matter, rad, k, darkE)[1,0], -20, 0)
t = np.linspace(t0, xlim[-1], 5001)
a = [scale(tt, matter, rad, k, darkE)[1,0] for tt in t]
plt.plot(t, a, zorder=-1,
label=ur'$\Omega_m=0.\!3,\Omega_\Lambda=0.\!7$, $\Lambda$CDM')
# Empty universe
matter=0; rad=0; k=1; darkE=0
t0 = op.brentq(lambda t: scale(t, matter, rad, k, darkE)[1,0], -20, 0)
t = np.linspace(t0, xlim[-1], 5001)
a = [scale(tt, matter, rad, k, darkE)[1,0] for tt in t]
plt.plot(t, a, label=ur'$\Omega_k=1$, empty universe', zorder=-3)
'''
# Open Friedmann
matter=0.5; rad=0.; k=0.5; darkE=0
t0 = op.brentq(lambda t: scale(t, matter, rad, k, darkE)[1,0], -20, 0)
t = np.linspace(t0, xlim[-1], 5001)
a = [scale(tt, matter, rad, k, darkE)[1,0] for tt in t]
plt.plot(t, a, label=ur'$\Omega_m=0.\!5, \Omega_k=0.5$')
'''
# Einstein de Sitter http://en.wikipedia.org/wiki/Einstein–de_Sitter_universe
matter=1.; rad=0.; k=0; darkE=0
t0 = op.brentq(lambda t: scale(t, matter, rad, k, darkE)[1,0], -20, 0)
t = np.linspace(t0, xlim[-1], 5001)
a = [scale(tt, matter, rad, k, darkE)[1,0] for tt in t]
plt.plot(t, a, label=ur'$\Omega_m=1$, Einstein de Sitter', zorder=-4)
'''
# Radiation dominated
matter=0; rad=1.; k=0; darkE=0
t0 = op.brentq(lambda t: scale(t, matter, rad, k, darkE)[1,0], -20, 0)
t = np.linspace(t0, xlim[-1], 5001)
a = [scale(tt, matter, rad, k, darkE)[1,0] for tt in t]
plt.plot(t, a, label=ur'$\Omega_r=1$')
'''
# Closed Friedmann
matter=6; rad=0.; k=-5; darkE=0
t0 = op.brentq(lambda t: scaled_closed_matteronly(t, matter)-1e-9, -20, 0)
t1 = op.brentq(lambda t: scaled_closed_matteronly(t, matter)-1e-9, 0, 20)
t = np.linspace(t0, t1, 5001)
a = [scaled_closed_matteronly(tt, matter) for tt in t]
plt.plot(t, a, label=ur'$\Omega_m=6, \Omega_k=\u22125$, closed', zorder=-5)
plt.xlabel('t [Gyr]')
plt.ylabel(ur'$a/a_0$')
plt.legend(loc='upper left', borderaxespad=0.6, handletextpad=0.5)
plt.savefig(name)
mplwp.postprocess(name)
|


Llicència
Jo, el titular dels drets d'autor d'aquest treball, el public sota la següent llicència:
This file is licensed under the Creative Commons Attribution-Share Alike 4.0 International license.
- Sou lliure de:
- compartir – copiar, distribuir i comunicar públicament l'obra
- adaptar – fer-ne obres derivades
- Amb les condicions següents:
- reconeixement – Heu de donar la informació adequada sobre l'autor, proporcionar un enllaç a la llicència i indicar si s'han realitzat canvis. Podeu fer-ho amb qualsevol mitjà raonable, però de cap manera no suggereixi que l'autor us dóna suport o aprova l'ús que en feu.
- compartir igual – Si modifiqueu, transformeu, o creeu a partir del material, heu de distribuir les vostres contribucions sota una llicència similar o una de compatible amb l'original.
Historial del fitxer
Cliqueu una data/hora per veure el fitxer tal com era aleshores.
| Data/hora | Miniatura | Dimensions | Usuari/a | Comentari | |
|---|---|---|---|---|---|
| actual | 01:12, 17 abr 2017 | | 600 × 450 (57 Ko) | wikimediacommons>Geek3 | validator fix |
Ús del fitxer
La pàgina següent utilitza aquest fitxer: