Fitxer:Prime number theorem ratio convergence.svg
Salta a la navegació
Salta a la cerca

Mida d'aquesta previsualització PNG del fitxer SVG: 250 × 160 píxels. Altres resolucions: 320 × 205 píxels | 640 × 410 píxels | 1.024 × 655 píxels | 1.280 × 819 píxels | 2.560 × 1.638 píxels.
Fitxer original (fitxer SVG, nominalment 250 × 160 píxels, mida del fitxer: 87 Ko)
Resum
| Descripció |
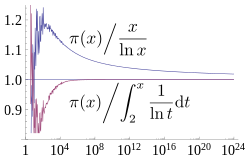
English: A plot showing how two estimates described by the prime number theorem, and converge asymptotically towards , the number of primes less than x. The x axis is and is logarithmic (labelled in evenly spaced powers of 10), going up to 1024, the largest for which is currently known. The former estimate converges extremely slowly, while the latter has visually converged on this plot by 108. Source used to generate this chart is shown below. |
| Data | |
| Font | Treball propi |
| Autor | Dcoetzee |
| SVG genesis |


Llicència
Jo, el titular dels drets d'autor d'aquest treball, el public sota la següent llicència:
| L'ús d'aquest fitxer és regulat sota les condicions de Creative Commons de CC0 1.0 lliurament al domini públic universal. | |
| La persona que ha associat un treball amb aquest document ha dedicat l'obra domini públic, renunciant en tot el món a tots els seus drets de d'autor i a tots els drets legals relacionats que tenia en l'obra, en la mesura permesa per la llei. Podeu copiar, modificar, distribuir i modificar l'obra, fins i tot amb fins comercials, tot sense demanar permís.
|
Source
All source released under CC0 waiver.
Mathematica source to generate graph (which was then saved as SVG from Mathematica):
(* Sample both functions at 600 logarithmically spaced points between \
1 and 2^40 *)
base = N[E^(24 Log[10]/600)];
ratios = Table[{Round[base^x],
    N[PrimePi[Round[base^x]]/(base^x/(x*Log[base]))]}, {x, 1,
    Floor[40/Log[2, base]]}];
ratiosli =
  Table[{Round[base^x],
    N[PrimePi[
       Round[base^x]]/(LogIntegral[base^x] - LogIntegral[2])]}, {x,
    Ceiling[Log[base, 2]], Floor[40/Log[2, base]]}];
(* Supplement with larger known PrimePi values that are too large for \
Mathematica to compute *)
LargePiPrime = {{10^13, 346065536839}, {10^14, 3204941750802}, {10^15,
     29844570422669}, {10^16, 279238341033925}, {10^17,
    2623557157654233}, {10^18, 24739954287740860}, {10^19,
    234057667276344607}, {10^20, 2220819602560918840}, {10^21,
    21127269486018731928}, {10^22, 201467286689315906290}, {10^23,
    1925320391606803968923}, {10^24, 18435599767349200867866}};
ratios2 =
  Join[ratios,
   Map[{#[[1]], N[#[[2]]]/(#[[1]]/(Log[#[[1]]]))} &, LargePiPrime]];
ratiosli2 =
  Join[ratiosli,
   Map[{#[[1]], N[#[[2]]]/(LogIntegral[#[[1]]] - LogIntegral[2])} &,
    LargePiPrime]];
(* Plot with log x axis, together with the horizontal line y=1 *)
Show[LogLinearPlot[1, {x, 1, 10^24}, PlotRange -> {0.8, 1.25}],
 ListLogLinearPlot[{ratios2, ratiosli2}, Joined -> True],
 LabelStyle -> FontSize -> 14]
LaTeX source for labels:
$$ \left.{\pi(x)}\middle/{\frac{x}{\ln x}}\right. $$
$$ \left.{\pi(x)}\middle/{\int_2^x \frac{1}{\ln t} \mathrm{d}t}\right. $$
These were converted to SVG with [1] and then the graph was embedded into the resulting document in Inkscape. Axis fonts were also converted to Liberation Serif in Inkscape.
Historial del fitxer
Cliqueu una data/hora per veure el fitxer tal com era aleshores.
| Data/hora | Miniatura | Dimensions | Usuari/a | Comentari | |
|---|---|---|---|---|---|
| actual | 14:07, 21 març 2013 | | 250 × 160 (87 Ko) | wikimediacommons>Dcoetzee | Change n to x to match article |
Ús del fitxer
La pàgina següent utilitza aquest fitxer: